Recommended Standards
Over the years of providing auroral data, we (UCalgary) have found a few standards that have been very beneficial to adhere to. Though we don't require any specific data standards in AuroraX, we do outline some of our recommendations in the following sections. These recommendations are from the UCalgary group.
Synchronized data acquisition
As our ground-based auroral imaging systems have become more distributed across the world, we have found it important to synchronize the times that all systems take a picture. We do this with two strategies: 1) all data acquisition computers have their time synchronized using GPS clocks, and 2) data acquisition software is written to initiate each image collection at the same time.
Since all our systems are Linux-based, we can leverage services such as NTP and chronyd to synchronize the computer's time with external timing sources (ie. locally attached GPS, remote time servers, etc.).
Regarding point #2, we can use THEMIS as an example. The THEMIS ASI array consists of 20 ASIs across Canada, the US, and Greenland, and collects a 1-second exposure at a 3-second cadence. The data acquisition software for each instrument initiates an exposure at the the second 0, 3, 6, ..., 51, 54, 57. We do this so that the data produced is easier to use, consistent, and summary products such as keograms can be trivially created (as discussed below). This strategy is in contrast to starting an image exposure every 3-seconds when the software started running (ie. 1, 4, 7; or another day it could be 2, 5, 8; or another day it could be 0, 3, 6). We found that this approach causes some headaches down the road, most notably prohibiting keograms from being as accurate as they could be.
Keograms
The keograms that we generate for UCalgary projects such as THEMIS, REGO, and TREx are formatted in a way that is most beneficial for comparing to others quickly. The have the following specifications:
- "full-bleed" images; there are no axes or borders
- white columns signify times where there is no data for the corresponding time (ie. image initialized to white, and then filled in with data for each column)
- hourly and daily keograms are generated
- daily keograms are 720px wide. A column of pixels represents the data from images every 10 minutes
- keograms are byte scaled using one of two methods:
- 99th percentile (min is 1st percentile, max is 99th percentile), or
- min and max are statically set values which are the same across an instrument array (ie. all of REGO has the same min and max scaling)


By sticking to this standard, we can easily stack many keograms vertically and compare them, as seen below.
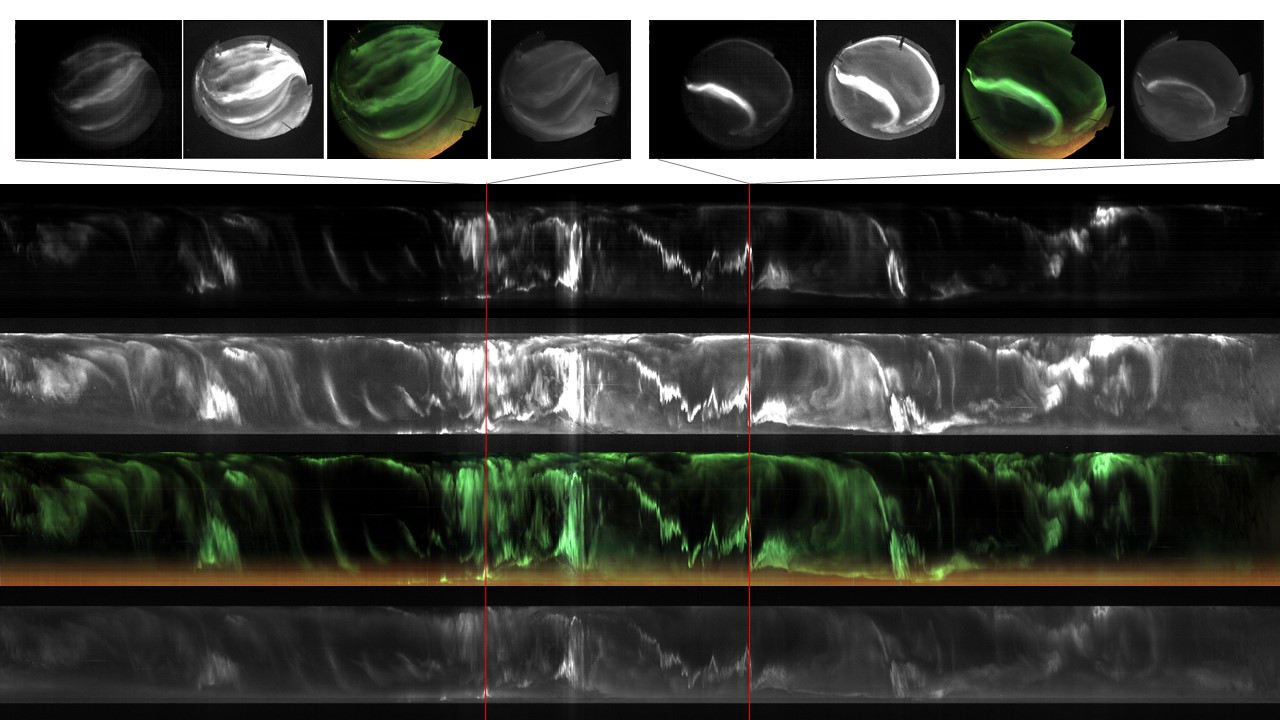
Stacked keograms from top to bottom: TREx Blueline, TREx NIR, TREx RGB, REGO